Comparing Model Projections with Reality: Experiences from Modelling Building Stock Energy Use in Norway
| dc.contributor.author | Lien, Synne Krekling | |
| dc.contributor.author | Sandberg, Nina Holck | |
| dc.contributor.author | Lindberg, Karen Byskov | |
| dc.contributor.author | Rosenberg, Eva | |
| dc.contributor.author | Seljom, Pernille Merethe Sire | |
| dc.contributor.author | Sartori, Igor | |
| dc.date.accessioned | 2022-05-27T09:49:31Z | |
| dc.date.available | 2022-05-27T09:49:31Z | |
| dc.date.created | 2022-05-20T08:05:46Z | |
| dc.date.issued | 2022 | |
| dc.identifier.issn | 0378-7788 | |
| dc.identifier.uri | https://hdl.handle.net/11250/2996394 | |
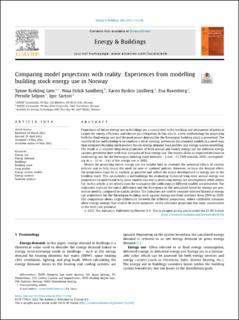
| dc.description.abstract | Projections of future energy use in buildings are a crucial tool in the tracking and attainment of political targets for energy efficiency and climate gas mitigation. In this article, a new methodology for projecting both the final energy use and the peak power demand for the Norwegian building stock is presented. The novelty of the methodology is to combine a set of existing, previously documented models in a novel way that integrates building stock models, hourly energy demand load profiles, and energy system modelling. The result is a coherent long-term projection of both annual and hourly energy use for different energy carriers, presented here with four scenarios of final energy use. The results show an expected decrease in total energy use for the Norwegian building stock between −2 and −12 TWh towards 2050, corresponding to a −3% to −14% of the energy use in 2020. Models for projecting future energy use are helpful both to evaluate the potential effects of current policies and to help reveal the need for new or updated policies. However, to have the desired effect, the projections must be as realistic as possible and reflect the actual development in energy use in the building stock. This necessitates a methodology for evaluating historical long-term annual energy use projections to understand why some models succeed in predicting energy use development while others fail. In this article, a set of indicators for evaluating the calibration of different models are presented. The indicators evaluate the initial difference and the divergence in the annualised trend for energy use projection models, compared to statistical data. The indicators are used to compare selected historical energy use projections for the Norwegian building stock against energy use from statistics from 2000 to 2020. The comparison shows large differences between the different projections, where calibrated scenarios show energy savings that tend to be more optimistic in the reference projection but more conservative in the best case potential. | en_US |
| dc.language.iso | eng | en_US |
| dc.publisher | Elsevier | en_US |
| dc.rights | CC BY 4.0 | * |
| dc.rights.uri | http://creativecommons.org/licenses/by/4.0/deed.no | * |
| dc.subject | Energy use | en_US |
| dc.subject | Energy demand | en_US |
| dc.subject | Buildings | en_US |
| dc.subject | Building stock | en_US |
| dc.subject | Load profiles | en_US |
| dc.subject | Energy system models | en_US |
| dc.subject | Energy analysis | en_US |
| dc.subject | Scenario analysis | en_US |
| dc.title | Comparing Model Projections with Reality: Experiences from Modelling Building Stock Energy Use in Norway | en_US |
| dc.title.alternative | Comparing Model Projections with Reality: Experiences from Modelling Building Stock Energy Use in Norway | en_US |
| dc.type | Peer reviewed | en_US |
| dc.type | Journal article | en_US |
| dc.description.version | publishedVersion | en_US |
| dc.rights.holder | © 2022 The authors | en_US |
| dc.subject.nsi | VDP::Teknologi: 500 | en_US |
| dc.source.volume | 268 | en_US |
| dc.source.journal | Energy and Buildings | en_US |
| dc.identifier.doi | 10.1016/j.enbuild.2022.112186 | |
| dc.identifier.cristin | 2025805 | |
| dc.relation.project | Norges forskningsråd: 294920 | en_US |
| dc.source.articlenumber | 112186 | en_US |
| cristin.ispublished | true | |
| cristin.fulltext | original | |
| cristin.qualitycode | 2 |
Tilhørende fil(er)
Denne innførselen finnes i følgende samling(er)
-
Publikasjoner fra CRIStin - SINTEF AS [5852]
-
SINTEF Community [2270]

Med mindre annet er angitt, så er denne innførselen lisensiert som CC BY 4.0