Flexibility chart 2.0: An accessible visual tool to evaluate flexibility resources in power systems
| dc.contributor.author | Yasuda, Yoh | |
| dc.contributor.author | Carlini, Enrico Maria | |
| dc.contributor.author | Estanqueiro, Ana | |
| dc.contributor.author | Eriksen, Peter Børre | |
| dc.contributor.author | Flynn, Damian | |
| dc.contributor.author | Herre, Lars Finn | |
| dc.contributor.author | Hodge, Bri-Mathias | |
| dc.contributor.author | Holttinen, Hannele | |
| dc.contributor.author | Koivisto, Matti Juhani | |
| dc.contributor.author | Gómez-Lózaro, Emilio | |
| dc.contributor.author | Martínez, Sergio Martín | |
| dc.contributor.author | Menemenlis, Nickie | |
| dc.contributor.author | Morales-España, Germán | |
| dc.contributor.author | Pellinger, Christoph | |
| dc.contributor.author | Ramos, Andrés | |
| dc.contributor.author | Smith, Charlie | |
| dc.contributor.author | Vrana, Til Kristian | |
| dc.date.accessioned | 2024-01-15T11:08:39Z | |
| dc.date.available | 2024-01-15T11:08:39Z | |
| dc.date.created | 2023-03-31T08:51:04Z | |
| dc.date.issued | 2023 | |
| dc.identifier.citation | Renewable and Sustainable Energy Reviews. 2023, 174 . | en_US |
| dc.identifier.issn | 1364-0321 | |
| dc.identifier.uri | https://hdl.handle.net/11250/3111497 | |
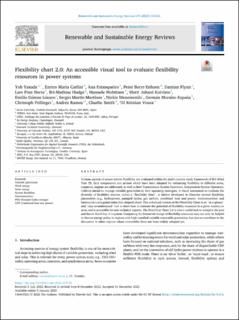
| dc.description.abstract | Various aspects of power system flexibility are evaluated within the multi-country study framework of IEA Wind Task 25. Grid components and actions which have been adopted for enhancing flexibility in different areas, countries, regions are addressed, as well as how Transmission System Operators, Independent System Operators, Utilities intend to manage variable generation in their operating strategies. A visual assessment to evaluate the diversity of flexibility sources, called a “flexibility chart”, is further developed to illustrate several flexibility parameters (e.g., hydropower, pumped hydro, gas turbine, combined heat and power, interconnection and battery) in a polygonal radar (fan-shaped) chart. This enhanced version of the Flexibility Chart is an “at-a-glance” and “easy-to-understand” tool to show how to estimate the potential of flexibility resources in a given country or area, and is accessible for non-technical experts. The Flexibility Chart 2.0 is also a useful tool to compare the past and future flexibility of a system. Comparing the historical change of flexibility resources may not only be helpful to discuss energy policy in regions with high installed variable renewable generation, but also to contribute to the discussion in other regions where renewables have not been widely adopted yet. | en_US |
| dc.language.iso | eng | en_US |
| dc.publisher | Elsevier | en_US |
| dc.rights | Navngivelse 4.0 Internasjonal | * |
| dc.rights.uri | http://creativecommons.org/licenses/by/4.0/deed.no | * |
| dc.title | Flexibility chart 2.0: An accessible visual tool to evaluate flexibility resources in power systems | en_US |
| dc.title.alternative | Flexibility chart 2.0: An accessible visual tool to evaluate flexibility resources in power systems | en_US |
| dc.type | Peer reviewed | en_US |
| dc.type | Journal article | en_US |
| dc.description.version | publishedVersion | en_US |
| dc.rights.holder | The Authors | en_US |
| dc.source.pagenumber | 0 | en_US |
| dc.source.volume | 174 | en_US |
| dc.source.journal | Renewable and Sustainable Energy Reviews | en_US |
| dc.identifier.doi | 10.1016/j.rser.2022.113116 | |
| dc.identifier.cristin | 2138740 | |
| dc.source.articlenumber | 113116 | en_US |
| cristin.ispublished | true | |
| cristin.fulltext | original | |
| cristin.qualitycode | 1 |
Tilhørende fil(er)
Denne innførselen finnes i følgende samling(er)
-
Publikasjoner fra CRIStin - SINTEF Energi [1614]
-
SINTEF Energi [1732]

Med mindre annet er angitt, så er denne innførselen lisensiert som Navngivelse 4.0 Internasjonal